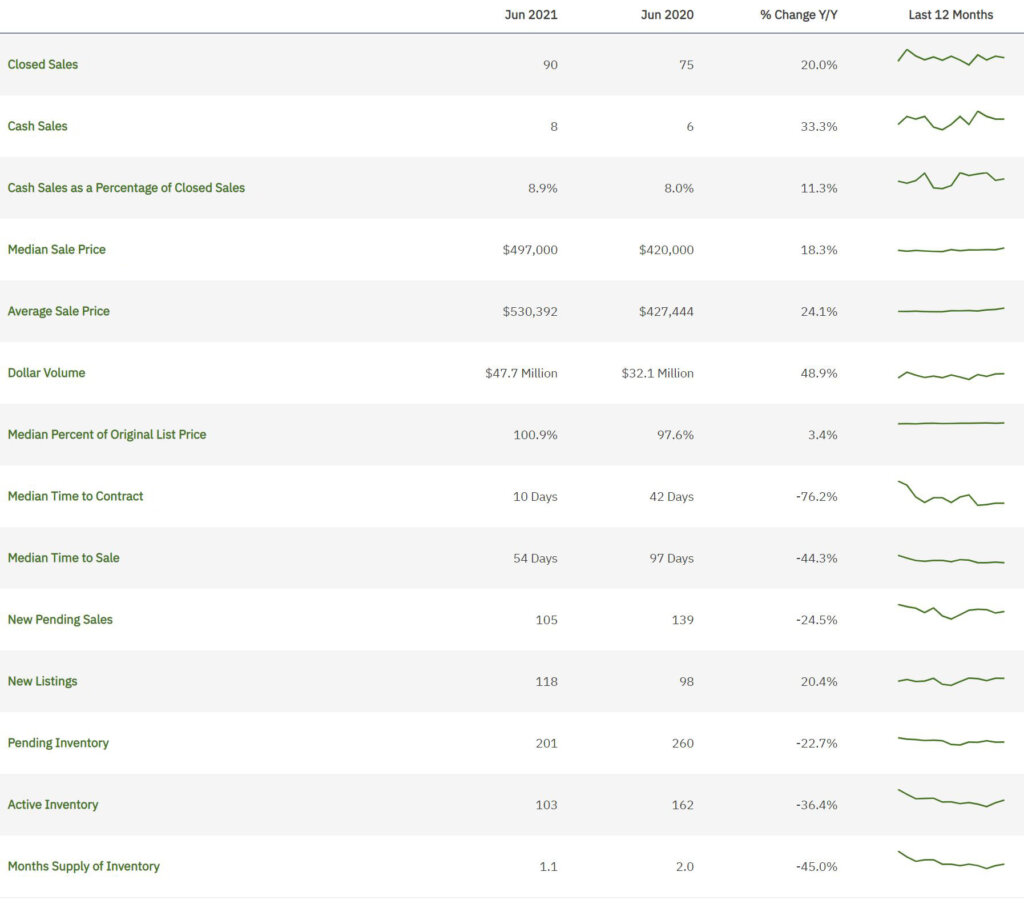
Below you will find the statistics for the real estate market for Single Family Homes sold within Miramar only. These statistics are for the month of June 2021. The list below includes various metrics and show this month’s numbers compared to last year during the same month. Below the list you will find charts for various metrics showing historical data for the last two years so you can get a sense of the direction the market is taking.
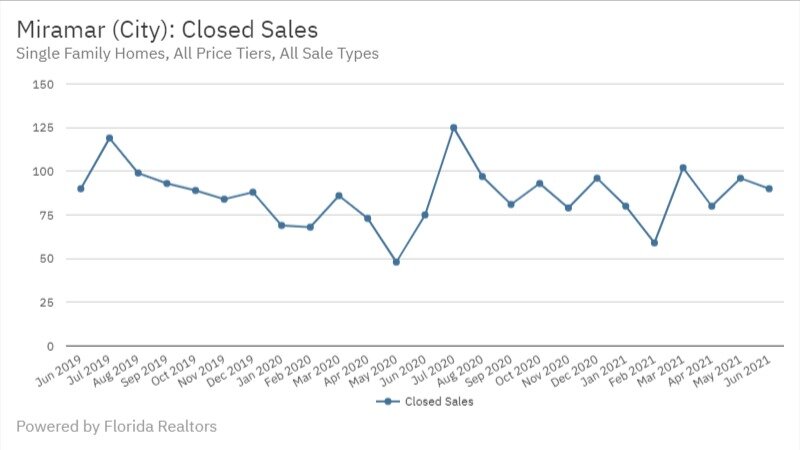
Closed Sales
This chart shows the total number of transactions that closed per month for the last 2 years.
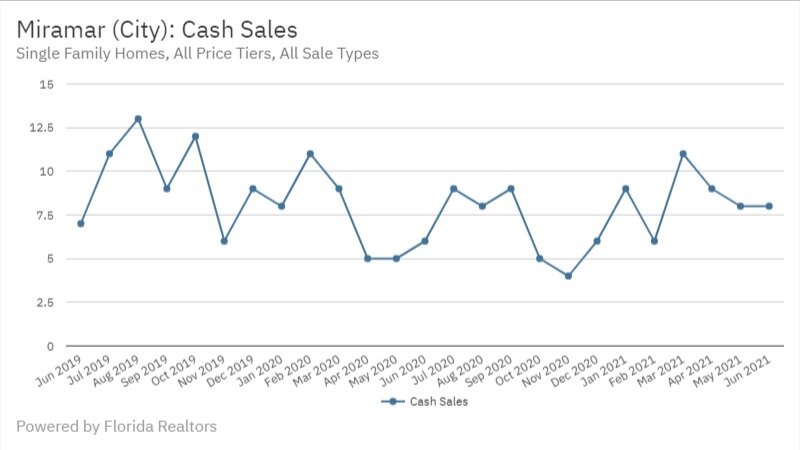
Cash Sales
This chart shows the total number of transactions that closed per month for the last 2 years where the buyer paid cash.
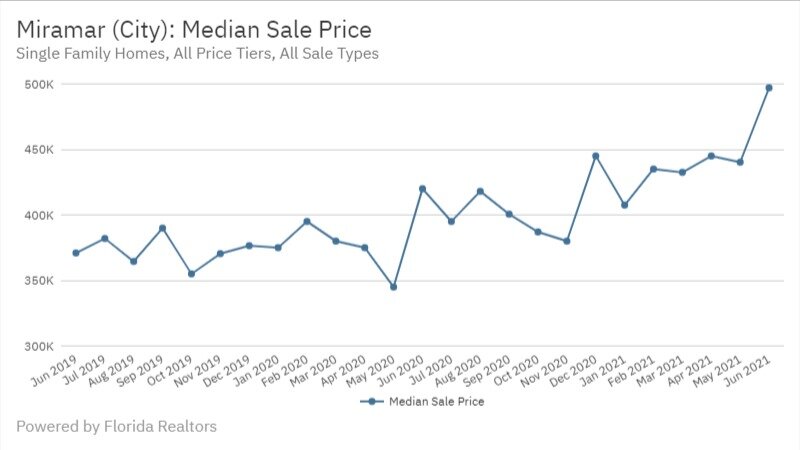
Median Sale Price
This chart shows the median sale price for all closed transactions for each month for the last 2 years. The median is different than the average. Where the average is calculated by adding all the final sale prices and dividing it by the total number of sales. The median is more like the mid point showing that half of all sales sold for less and half sold for more than the median price.
As you can see, prices keep going higher. This is due to a combination of the lack of inventory and increased demand.
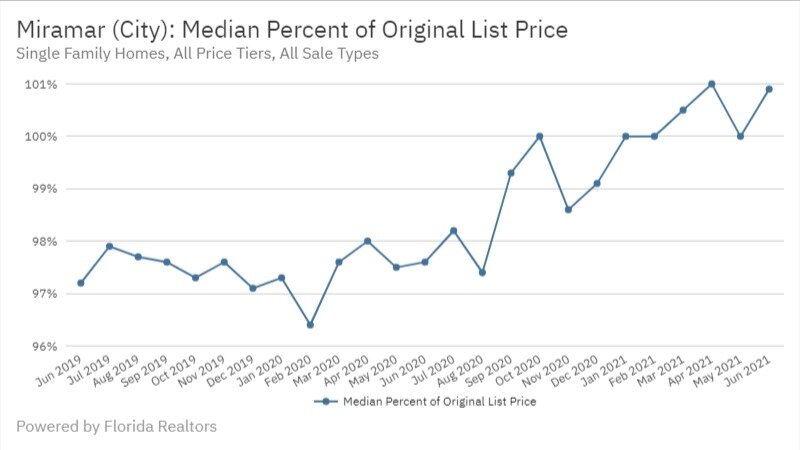
Median Percent of Original List Price
This chart shows the median percent of the original list price that the houses sold for in all the transactions for each month for the last 2 years. This metric shows how close the homes final sale price was to the original listing price.
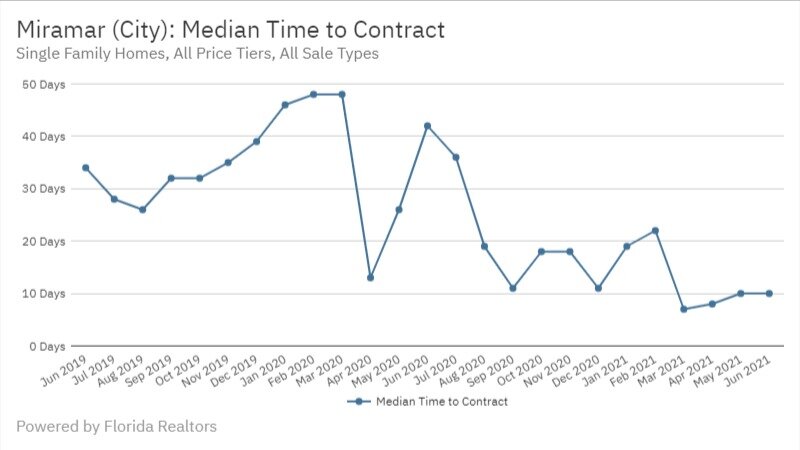
Median Time to Contract
This chart shows the median time to contract, also known as Days on Market. Days on market are the number of days it took to get the house under contract from the day it was listed.
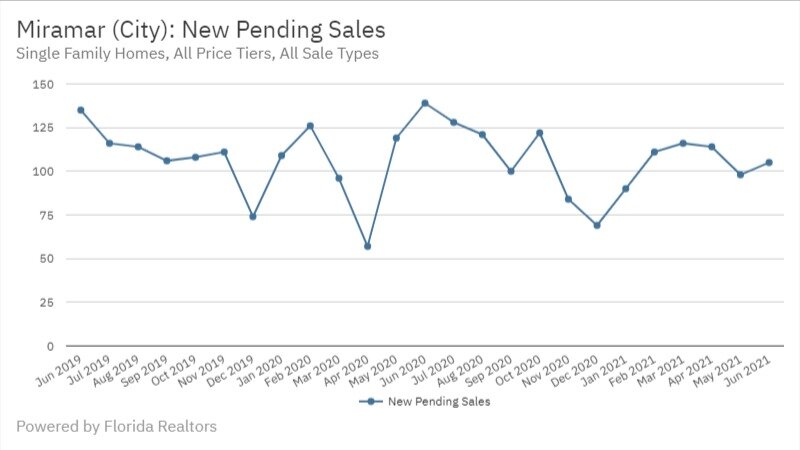
New Pending Sales
This chart shows the number of new pending sales. Pending sales are those homes that are under contract. This chart is showing the number of homes within the month that accepted a contract.
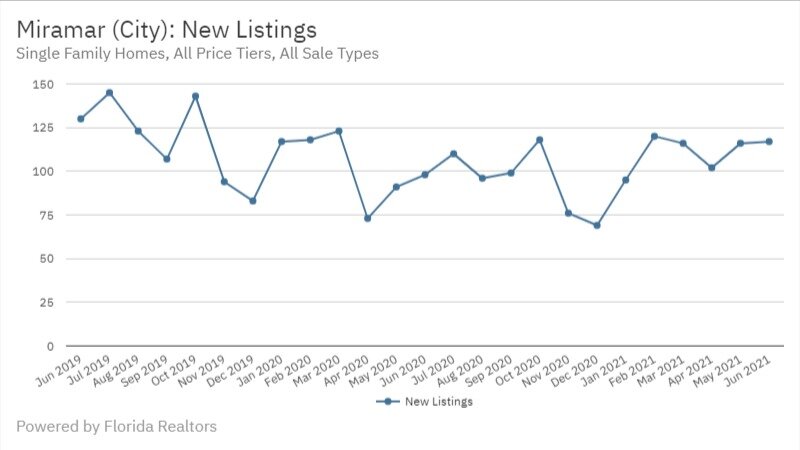
New Listings
This chart shows the number of new homes for sale that where added to the market.
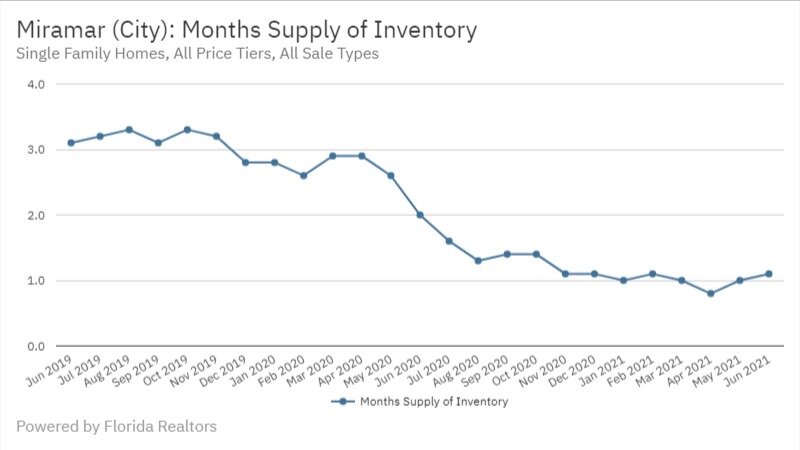
Months Supply of Inventory
This chart shows how many months it would take to sell all the homes in Miramar that are on the market at the current selling rate if there where no new homes added to the market for sale. A normal balanced market usually has about 6 months supply of inventory. If a market has much less than 6 months supply it’s considered a seller’s market due to the lack of inventory. If there is much more than a 6 month supply, that would be considered a buyer’s market due to the excess supply of homes for sale.
We have been in a seller’s market for a while now and the market keeps trending down showing less and less inventory each month.